Monitoring and Logging in Kubernetes


Kubernetes does not have a full-featured built-in monitoring solution. Heapster was there to monitor and analyze Kubernetes which is now deprecated.
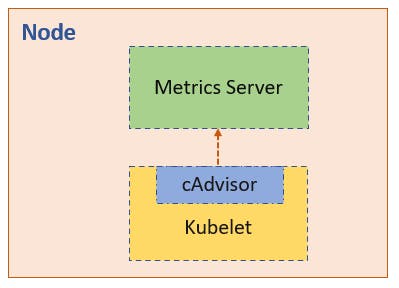
You can download Metrics Server binaries and setup in K8s cluster. A Metrics Server available for each cluster. It is an in-memory solution. You can get the historical analysis report. It receives metrics from each of the nodes and pods. Aggregates them and store them in memory.
In the Kubernetes cluster, kubelet agent runs on every node. It contains a sub-component known as cAdvisor. cAdvisor is responsible for retrieving performance metrics from pods and passing them to Metrics Server.
# check the node and pod metrics
kubectl top node
kubectl top pod
You can integrate any Open-Source (Metrics Server, Prometheus, Elastic Stack) or Proprietary solutions (Datadog, Dynatrace) for advanced monitoring. Such as performance metrics (CPU, memory, network, and disk utilization) of pod and node level wise.
Logging in Kubernetes
# Stream the logs live
kubectl logs -f <pod-name>

# If there are more than one container running inside a pod then mention the specific container name also
kubectl logs -f <pod-name> <container-name-running-inside-that-pod>